

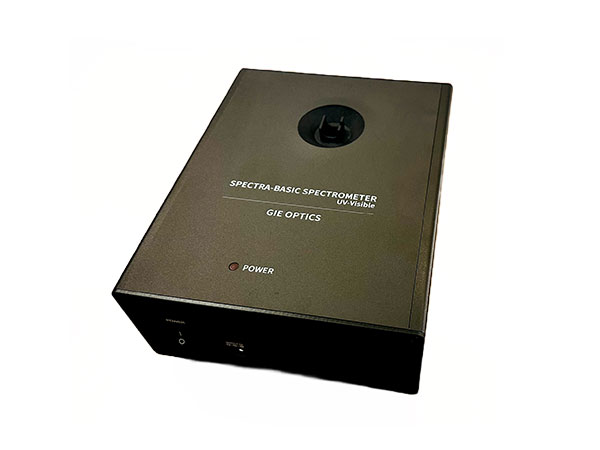
Spectra Basic is a UV-VIS wide spectrum range and easy-to-use UV-visible spectrometer that provides accurate and reliable data analysis in chemistry and biochemistry experimental teaching. It can be connected to a computer using USB and provides easy-to-use spectral analysis software.
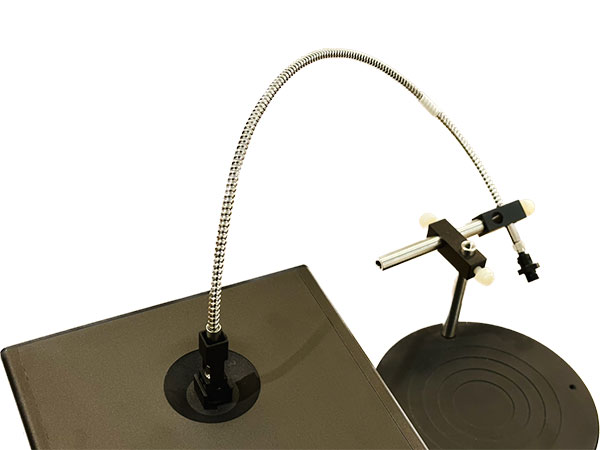
Spectra Basic improves experimental mobility and enables data analysis on Windows tablets. The instrument can be connected with external accessories to expand the performance of the spectrometer. For example, long optical fibers and collimating lenses can be added to measure the luminescence spectrum of active light sources, such as various lasers or various light sources.
Absorbance analysis mode:
A sample of synthetic acetyl salicylic acid dissolved in ethanol was analyzed using Absorbance Analysis Mode. The absorption spectrum of the sample shows that the sample has strong absorption spectra at 237 nm and 313 nm.
Concentration analysis mode: concentration and absorbance (Beer-Lambert law)
Determine the concentration of purified protein using the Beer-Lambert law in "Concentration Analysis Mode". After selecting the target wavelength in the Absorbance Analysis Mode screen, five protein standards (BSA) of known concentrations were analyzed. A linear fit was applied to create a standard curve, and the concentration of the unknown protein was determined to be 0.215 mmol/L.
Time Analysis Mode: Time and Absorbance (Dynamic Analysis)
Use Time Analysis Mode to measure the fading of phenolphthalein in NaOH over time. For samples with different concentrations of NaOH, the absorbance at wavelengths relevant to phenolphthalein was measured over time.
Light Analysis Mode: Wavelength and Light Intensity
An additional quartz fiber optic kit is used to analyze the intensity of various spectral sources in the UV-visible spectrum. The spectrum of helium is shown below using "Light Analysis Mode"